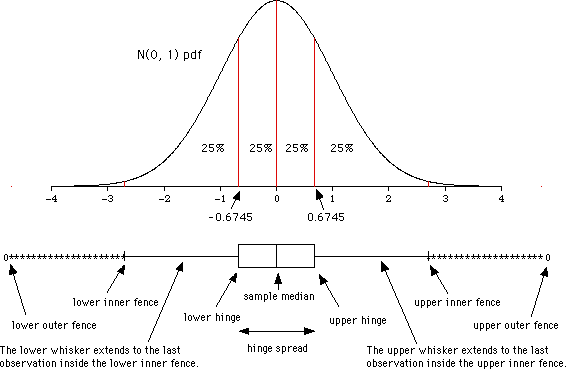
One way to understand a box plot is to think of what a box plot of data from a normal distribution will look like. The graph below shows a standard normal probability density function ruled into four quartiles, and the box plot you would expect if you took a very large sample from that distribution.
The centre line of the box is the sample median and will estimate the median of the distribution, which is, of course, 0 in this example.
The upper and lower hinges are the medians of the upper and lower halves of the sample, hence they are estimates of the third and first quartiles. For the N(0, 1) distribution in this example, the third and first quartiles are 0.6745 and -0.6745, respectively. The expected hinge spread will therefore be about 1.35.
The inner fences are 1.5 hinge spreads beyond the hinges, or 2 hinge spreads (2.7 units in this example) above and below the median. The whiskers extend to the last observations inside the upper and lower inner fences. If the data are a small sample from a normal distribution, there will be very few observations beyond the inner fences. The larger the sample, however, the more observations we would expect beyond the fences. Any observation between the inner fence and the outer fence is denoted by a *.
The outer fences are 3 hinge spreads beyond the hinges, or 3.5 hinge spreads (4.73 units in this example) above and below the median. If the data are really from a normal distribution, there are not likely to be any observations beyond the outer fences, even if the sample size is large. Any observation beyond the outer fences is denoted by an O. Observations beyond the outer fences should be considered outliers if the data are assumed to come from a normal distribution.
There is a big advantage in using the median and quartiles instead of the mean and standard deviation if we need to check for outliers. The farther out an outlier is, the more effect it will have on the mean and standard deviation. In contrast, the median and quartiles will not be affected by observations beyond the quartiles. As long as the observation stays beyond a quartile, the quartile, and hence the hinges, hinge spread, and fences, will be unaffected by its value, revealing the presence of the outlier more clearly.
